cm3015 Topic 04: Model Improvement
Main Info
Title: Model Improvement
Teachers: Jamie Ward
Semester Taken: October 2021
Parent Module: cm3015 Machine Learning and Neural Networks
Description
Covers overfitting, identifying that overfitting has occurred and alleviating it. Includes cross-validation and regularisation.
Key Reading
Chollet: Chapter O5: Fundamentals of Machine Learning (esp. 5.2 Evaluating Machine Learning Models - this was 4.2 in first edition). Other sections are also relevant though, especially Improving Model Fit
Other Reading
Lecture Summaries
4.101 Overfitting and Underfitting
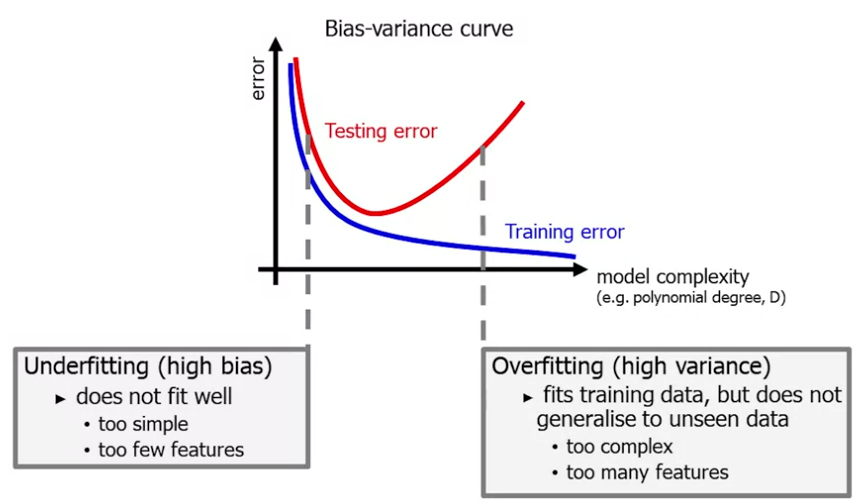
When fitting our model to the data we might find that the model underfits, ie it overly simple and misses the data. It has a high bias - overly simple and inflexible.
We might also find that it overfits, eg with a high degree polynomial we could hit every data point exactly but have a high variance - an overly complex line that is just suited to our data points.
Ideally what we want is something in between. We want the model to fit well but be generalizable. We follow ‘Ockham’s Razor’, “plurality should not be posited without necessity”.
We can plot a bias/variance curve. Along the x axis we plot model complexity (eg degree of the polynomial) and on the y axis the degree of error:

How do we ensure generalisable models?
Reduce the number of features. Manually select which features to keep, tedious and difficult. Or automate, use a model selection algorithm (cross-validation).
Regularisation, keep all features but reduce the values of parameters \(\theta_j\).
4.201 Regularisation
A method of penalizing complexity in a ML model.
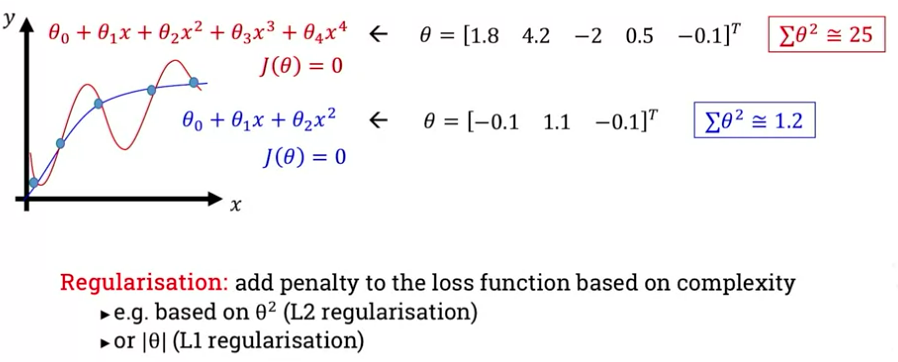
Let’s take the example of two models that fit our data perfectly, one a fourth degree polynomial and one quadratic. How do we train our model selection to favour the simpler one?
One approach is to take a linear combination of the weights - sum their squares. We add a penalty to the loss function based on the complexity (the sum of squares), this is L2 regularization. Or we could take their absolute value, this is L1 regularization:

Let’s focus on L2 regularisation. We need to add a new term to the loss function:
\[J(\theta) = \frac{1}{2m} \sum^m_{i=1} (h_\theta (x^{(i)} - y^{(i)})^2 + \lambda \sum^n_{j=1} \theta_j^2\]
So we add the loss multiplied by a hyperparameter \(\lambda\). If \(\lambda\) is too big the algorithm underfits, if too small it may overfit.
We also update the gradient descent algorithm. Updating the bias is the same as before, but for the other weights we differentiate the regularization and include it in the gradient descent.
4.301 Cross Validation
We typically have a train-test split among the data. The test data acts as a proxy for real world data.
Often don’t have enough data to do this with, so we can use a technique called N-fold cross validation.
We take a ‘fold’ of the data, splitting out a test set, train on the remainder and store the error. Then we take another fold with a different set reserved for testing, and repeat. We take the average error.
This works well for algorithms with fixed hyperparameters. Eg KNN with k=1, distance=Euclidean.
But we might have a set of hyperparameters that we want to test. (eg distance={Euclidean,Manhattan}).
We might want to run a training iteration on a fixed training set for each hyperparameter, but this leads to overfitting.
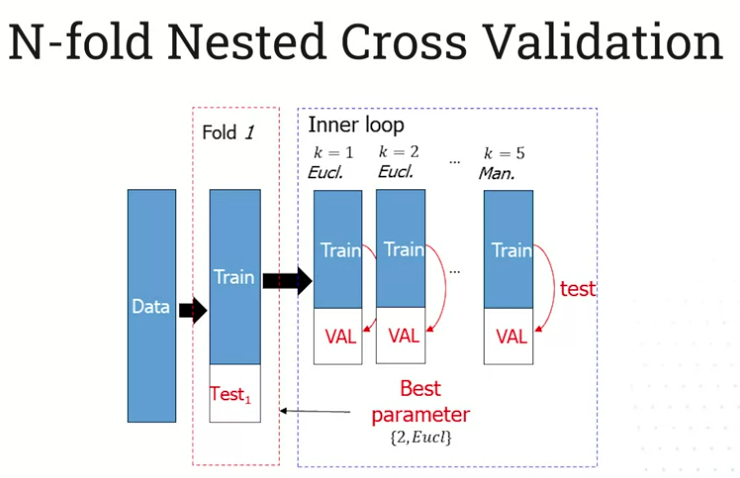
The solution is to split data into test, train, and validation sets. We evaluate the hyperparameters with the validation set.
This is N-Fold Nested Cross Validation. Here’s a visualization of the first loop:

4.302 The Curse of Dimensionality
We might find that increasing the dimensions helps us discriminate the data. But if we do it too much the data becomes sparse and we make our problem harder.
This is known as the curse of dimensionality, the idea that less is more. Classifier performance peaks at a certain # of dimensions and than starts to reduce. Space becomes bigger but our data does not.
How do we solve it? Increase the data to fill the space (expensive, not always possible). We could also reduce the number of dimensions, we’ll look at this later with PCA.
An ML challenge is can you find some intrinsic dimensionality in the data that builds successful models.
Lab Summaries
Only first of the three labs is actually there?
A solution to the tasks of defining a cross-validation process:
# using the built in split:
cvsplt = StratifiedShuffleSplit(n_splits=10, test_size=0.2, random_state=0)
scores = [knn.fit(X[train], y[train]).score(X[test], y[test]) for train, test in cvsplt.split(X, y)]

# defining your own
def myCrossVal(X,y,foldK):
accuracy_fold=[] #list to store accuracies folds
indices=np.random.permutation(len(X))
bins= np.array_split(indices, foldK)

#loop through folds
for i in range(0,foldK):
  foldTrain=[el for j in range(0, foldK) if j != i for el in bins[j] ] # list to save current indices for training
  foldTest= bins[i]  # list to save current indices for testing
  foldScore = knn.fit(X[foldTrain], y[foldTrain]).score(X[foldTest], y[foldTest])
  accuracy_fold.append(foldScore)
  return accuracy_fold;