CM3010 Topic 01: Working with Data
Main Info
Title: Working with Data
Teachers: David Lewis
Semester Taken: April 2022
Parent Module: cm3010: Databases and Advanced Data Techniques
Description
In this topic, you will learn to identify and evaluate sources of data, and to explore their underlying structure. We will also consider some legal and ethical aspects of data reuse.
Key Reading
Rawson and Munoz: Against Cleaning
A critical view of knowledge claims based on ‘data’, focusing on the issues around data ‘cleaning’, which is part of any data project but rarely open in its methods or results. Opacity around data ‘cleaning’ can exacerbate scepticism and reproducability issues in data-driven work.
The paper recounts the authors’ work on open menu data (see below), and how in ‘normalizing’ the data - resolving multiple spellings of the same food item for example, they found they were making judgements about the food items themselves and pursuing further research. They found that, rather than automating the process, it was better to surface the results of such automation and let people investigate.
They propose “indexing” as an alternative to “cleaning” - indexing preserves the original data but annotates it with ‘pointers’. The index provides access to the original concepts, while allowing normalized information to be layered on top.
Other Reading
A set of posts on an open menu data initiative in New York, linked data klaxon:
An article about the linked jazz project. Linked data klaxon:
Licensing:
Lecture Summaries
1.1 Data Sources
Where does data come from? We could start with two high level categories: either you’re working with pre-existing data, or you’re making it new as part of the system development.
Perhaps your system is a revamped version of existing practices - maybe you used spreadsheets before, now you want a db etc. This might involve internal legacy data in other formats. Or you might be working with external data that you buy in.
New data, is ‘add as you go’, say you’re setting up a system to take new bookings in a service. But often you’ll need some type of data migration and bulk entry in the new system.
You might need to extract old data, convert it to a new data model, and clean it - check the quality of the old data so it’s appropriate for the new db.
Why use external sources? Manpower and resource needed for data entry and quality checking. But then you have little control over data quality or structure. Data may be incomplete, ambiguous. Question of trustworthiness - do you trust the third party?
1.105 What does your data look like?
Walks through the process of data modelling. Uses the example of a book. How would we represent this object in a database? Depends on our purpose. If we’re a retailer we might care about its weight for shipping. If a librarian its height for shelving. Then there are more generic things, like title and its type ‘book’.
Uses the example of title to illustrate an issue. Looking at the book there are three different versions of the title included - spine, title page, title header at the start of the book. What do we pick? For finding the book on the shelf, we want the spine, but for finding books with similar titles maybe we want the longer forms.
We’ve barely started to capture all the information people might want to discover about this book. Data modelling is hard.
1.2 Using and Linking Data Sources
If we want to share data we have to agree on the license:
what are we sharing
who can we share it with, and under what terms
what uses can we make of it
Transboundary legal issues are complex, we distribute data from a location, to a location, but if sharing on the web we have little control over it when it’s published.
Waffly bit about why people share data. Product information is shared so customers know that it exists…
Why publish open data? Commercial reasons; ethical reasons; contract requirements (eg research institutions); interoperability.
Why not? Restrictions on source data; control of use; commercial value of data.
1.3 Data Structures
1.301 Introduction
When we model data we’ll talk about certain types of relationships and means of representation for data.
We also need to think about serialization - how we write data to a file or network connection/exchange protocol.
Structure also comes up in user interfaces, humans are more familiar and comfortable with certain structures.
We’ll look at tables, trees, graphs, media, documents/objects.
1.302: Tables
By far the most common way to present data. We’ll narrow the generic sense of table in the following ways:
Every row in the table represents a thing. Each column represents a type of information we associate with the thing.
This is pretty general purpose. So what does a table not represent? Something like this:

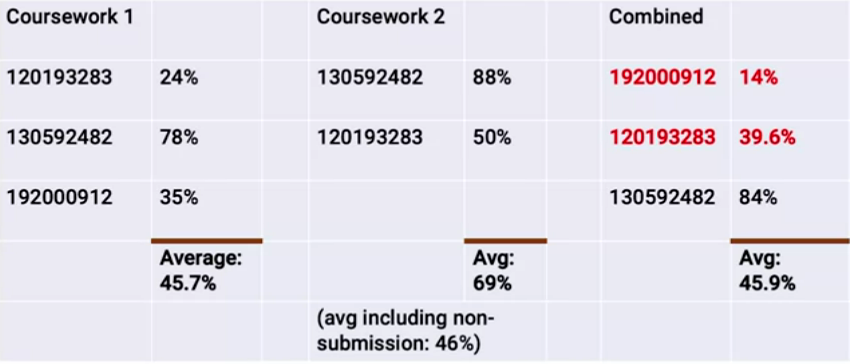
Columns here don’t represent a particular type of property, colours are used, rows aren’t entities etc.
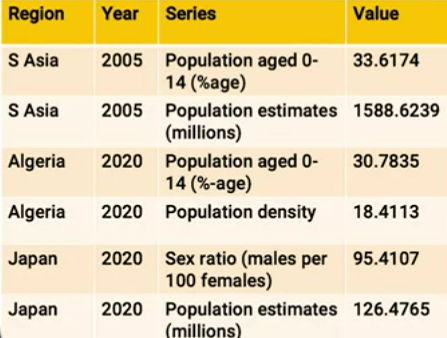
Here’s a middle ground, a common format you’ll see in open data publishing:

This is almost a table but… The only way we know what the value is involves looking at the ‘Series’ column and seeing whether it’s a % or a count in millions.
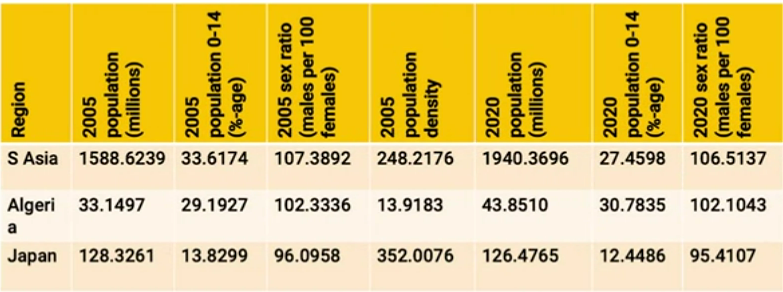
To make it a table in our narrow sense, we’d need to adapt it to this:

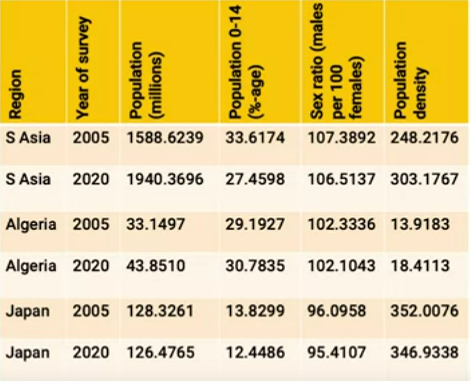
or this:

Tables are easy to process for people and computers. But it’s not great for data that branches, or has hierarchies. For that we need…
1.304: Trees
Trees in CS are usually described by metaphor with their natural counterparts.
The tree has a single root node, everything comes down through the root. At each branching point, we get multiple branches. Any given node can trace back to a single branch point, and then another single branch point, all the way down to the root.
Visually and linguistically we represent trees using metaphors of family trees, with the root at the top and the tree sitting ‘upside down’. We also talk about ‘parent’ nodes, ‘sibling’ nodes, ‘ancestors’ and ‘descendants’.
But there’s only one parent node for any child (unlike a family tree where you’ll have a father and mother).
Gives a slightly weird example of tree data (the Harry Potter series), which would be better as a graph or relational, does this to make the point in the next video that graphs are more natural for this data.
Says that trees are good for very heterogeneous data, where you don’t know how many of what things you are going to have at a given level of the tree, or in what order.
1.306: Other Data Structures
Why do we need anything more than tables and trees given that you could basically do anything with them?
Revisits the tree showing Harry Potter. One of the most important restrictions on trees is that any node can have 1..n child nodes but will have exactly 0 (root) or 1 (all others) parent nodes.
Shows the limitation of this when dealing with, for example, cast in a film. You want to model the ‘stars in relation’ across many common parents and children. So we change this to a graph instead. Now we can have multiple edges and can centre the graph at any point.
MUSICAL INTERLUDE
Switches to describing the ways that music is recorded. Musical notation on a page, or a realization of that in a performance. How do we retrieve the music based on aspects of its content? It has to be much richer than a series of data fields, hard to summarize in a database structure. We have symbolic forms of representations, raw sound waves, midi representation.
Same is true of films - screenplay, vs audio/video. Ways we handle this kind of data is going to be very different to typical database systems.
Data sizes are also likely to get large.
We have a menu now:
Tables - likely the default, general purpose option you’ll reach for if you can.
Trees - if data is naturally hierarchical this might be the best bet.
Graphs - heterogenous, non-hierarchical structure data.
Blobs - inaccessible data for storage.
Features - searchable information extracted or derived from blobs.
Documents - Rich but not interrelated data.