CM3035 Topic 10: Load Balancing, Scalability
Main Info
Title: Load Balancing, Scalability
Teachers: Daniel Buchan
Semester Taken: April 2022
Parent Module: cm3035: Advanced Web Development
Description
More advanced topics on deployment for production: Profiling and load balancing.
Key Reading
Other Reading
Performance tools
Lecture Summaries
10.1 Profiling and Performance
10.101 Profiling Web pages
When we want to understand our web site’s performance we need to profile it using some tools. The browsers offer a suite of tools for this.
Walks through the main tabs of the chrome developer tools.
10.104 Profiling Databases
The other main area of performance we’re interested in is often the database.
We can profile the database using tools like EXPLAIN ANALYZE <Query> which gives us the costs of different statements and execution time.
Usually you want the db to log problematic queries for you. In the postgres config you can fine the log_statement config setting, default is none, but you can change to all if you want. If you want to log duration you can change the log_duration setting to log the duration of all logged queries. You can use log_min_duration_statement to log statements running at least the integer of milliseconds. 2000 is a good benchmark as it will log queries taking more than 2 seconds.
10.107 Performance Testing
Performance testing is a way of characterizing how your application performs under different types of user loads.
There are different testing types:
| Test | Description |
|---|---|
| —- | ———– |
| Load Test | Measure performance under normal expected anticipated use |
| Stress Test | Determine system boundaries or bottlenecks |
| Soak Test | Simulate prolonged concurrent user behaviour |
We can use the requests module, threadpools and times, to mock up some very simple toy tests.
There are frameworks set up to do this properly. Python locust (https://locust.io), Apache JMeter (https://jmeter.apache.org) - they scale to many users and are flexible in reporting.
User expectations help set a target:
| Time | User Experience |
|---|---|
| —- | ————— |
| < 100ms | Appears instantaneous |
| 100-300ms | Small delay noticed |
| 1-2 seconds | Expected time for page load time |
| >3 seconds | Third of users will leave site |
| 10 seconds | Max time users will remain |
10.110 Django Dev Tools
Django provides profiling tools. You can install the ‘debug toolbar’ for this. Install with pip on django-debug-toolbar.
Installation is a bit involved. In settings you have to ensure debug is true. Add it to the INSTALLED_APPS, make sure static tools is also installed. Add the required middleware.
Add the setting for INTERNAL_IPS, another list, include localhost.
Change the project urls file as follows: import debug_toolbar, import the settings file. Then add a new path for __debug__, include the debug_toolbar.urls for the controller.
Then when you start the app you get the toolbar, which shows lots of info: request history, versions, CPU time, settings, headers, the actual SQL queries run, static files, templates that were used, caching, https signals and logs.
10.2 Scaling and Load Balancing
10.201 Scaling Problems
What does it mean when we have scaling problems?
We’ll see long page loads, users don’t stay, server crashes, hard to add new features, hard to change installation.
Causes would include lack of RAM, lack of threads/cores, poor application design - bad use of database queries, bad config (eg bad NGINX server config), bad logical separation of tasks.
Solutions include:
For lack of resource, get more resource - more ram, more servers, bigger servers, caching.
For poor design: fix poor SQL, correct configurations, cache better, separate concerns.
10.203 Load Balancing
When we start to think about scaling, one of the first things to look at is load balancing.
It’s the process of ensuring servers or applications see equal shares of work/processing, ensuring no individual server is overworked.
This allows us to add web servers and database servers.
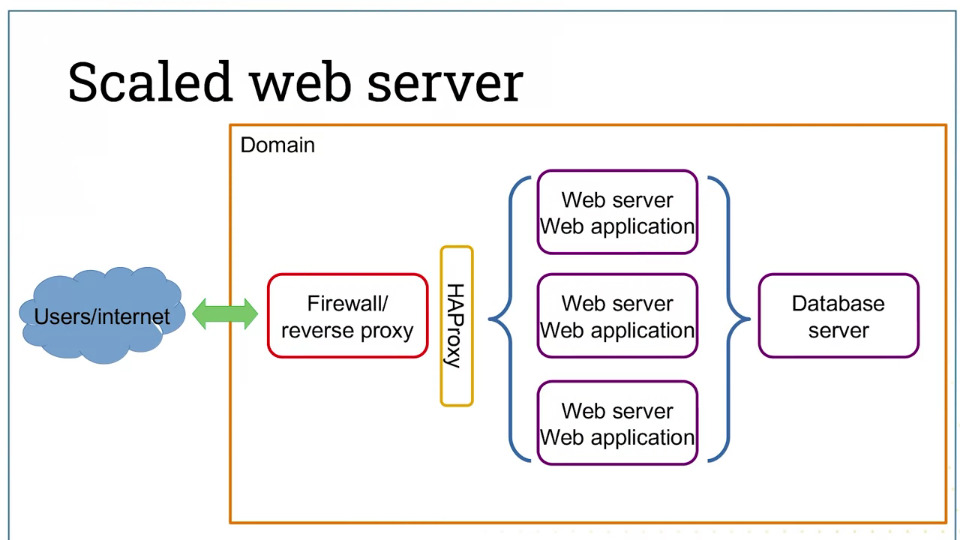
The most common pieces of software for this is HAProxy, it’s a TCP/HTTP load balancer.
It receives requests and farms them out to different machines to balance the load of each server, ensuring high availability and high throughput.
So the scaled version of the earlier architectures would look like this:

Now the request hits the load balancer and routes requests to the correct server. We can do the same thing with the database, again using HAProxy.
This also means that we don’t need to worry about a single server falling over.
10.205 Caching
One approach to help scale is caching. Caching aims to reduce the workload for the app.
For example, if you’re constantly running the same query to generate an html template, you might cache the resulting html page so you don’t need to run the query and build the page each time.
There are different caching options - in-database caching, filesystem caching (Apache and NGINX can do this), and most popular: memcached.
Memcached is an in-memory caching server. Much faster than on disk caching.
Runs where the web app runs.
Ships as part of Django, interface provided for most web app frameworks. Easy to use.
10.207 CDNs
Content Delivery Networks is an approach to scaling that is analogous to caching.
CDNs are an infrastructure for serving static assets. They are often large collections of media files: images, videos, audio files, etc.
There are two ways to do it - self-hosted content delivery servers (eg provisioned cloud servers).
Commercial content delivery - Akamai, CloudFront, Fastly, Verizon, Cloudfare etc).
Now only your dynamic parts go through the web application, static parts never hit your servers.